

TL;DR: Ecommerce conversion rate optimization means turning more of the traffic you already pay for into orders. The fastest wins start before the product page, in how shoppers search and find what they came for, then run through the product page, cart, and checkout. Fix the friction there, measure with real behavior data, and treat testing as a weekly habit.
You can double your traffic and still make the same money. That happens every day, and it is why conversion rate optimization (CRO) beats another ad budget increase for a growing store. If your Shopify store sits at a 1.4% conversion rate while traffic looks healthy, reach is fine and the checkout is where orders slip away. So where does the money leak, and which fixes move the number?
This guide maps ecommerce conversion rate optimization across the full buying journey, from the first search to the final payment tap. It moves in the order a shopper does, so you can find your biggest leak and fix that one first.
What Ecommerce Conversion Rate Optimization Is
Ecommerce conversion rate optimization is the practice of increasing the percentage of visitors who complete a purchase, using behavior data to find friction and remove it. The word optimization matters: it is a measured, repeatable process you run on evidence, one change at a time. You form a hypothesis about why shoppers drop off, change one thing, and check if the number moved.
Conversion rate is the share of sessions that end in a completed order.
Conversion rate = (orders / total sessions) × 100. A store with 400 orders from 20,000 sessions converts at 2%. Raising that to 3% on the same traffic is a 50% revenue increase with zero added ad spend.
Why CRO beats buying more traffic
More traffic multiplies your existing conversion rate, including all of its leaks. If 98 of every 100 visitors leave without buying, sending 10,000 more visitors just means more people watch the same broken checkout. CRO fixes the multiplier itself, which is why every dollar of improvement compounds across paid ads, email, and organic search at the same time. Fund and staff it like a channel, and it pays back on traffic you have already bought.
What Counts as a Good Ecommerce Conversion Rate in 2026
The global average ecommerce conversion rate sits at 2.72%, based on trailing twelve-month data across a large sample of stores. Anything above 3% puts you among the strongest-converting sites in your category. A store stuck near 1.4% has clear room to grow, and the gap is almost always friction inside the funnel.
Averages hide more than they reveal, so read them by device and by segment. Here is how the current benchmark breaks down:

A single site-wide number can hide a healthy desktop funnel and a broken mobile one. Segment your conversion rate by device, by traffic source, and by new against returning visitors before you decide anything is wrong, because the average is an average of very different journeys.
Where Your Funnel Leaks Revenue
Every store loses shoppers at five predictable points, starting before the product page: search and discovery, the product page, the add-to-cart moment, the cart, and the checkout. Each drop-off compounds the last, so a shopper who never finds the product and a 70% checkout abandonment stack into a conversion rate near 1%. Sealing the earliest leak first returns more than polishing a stage that already performs.
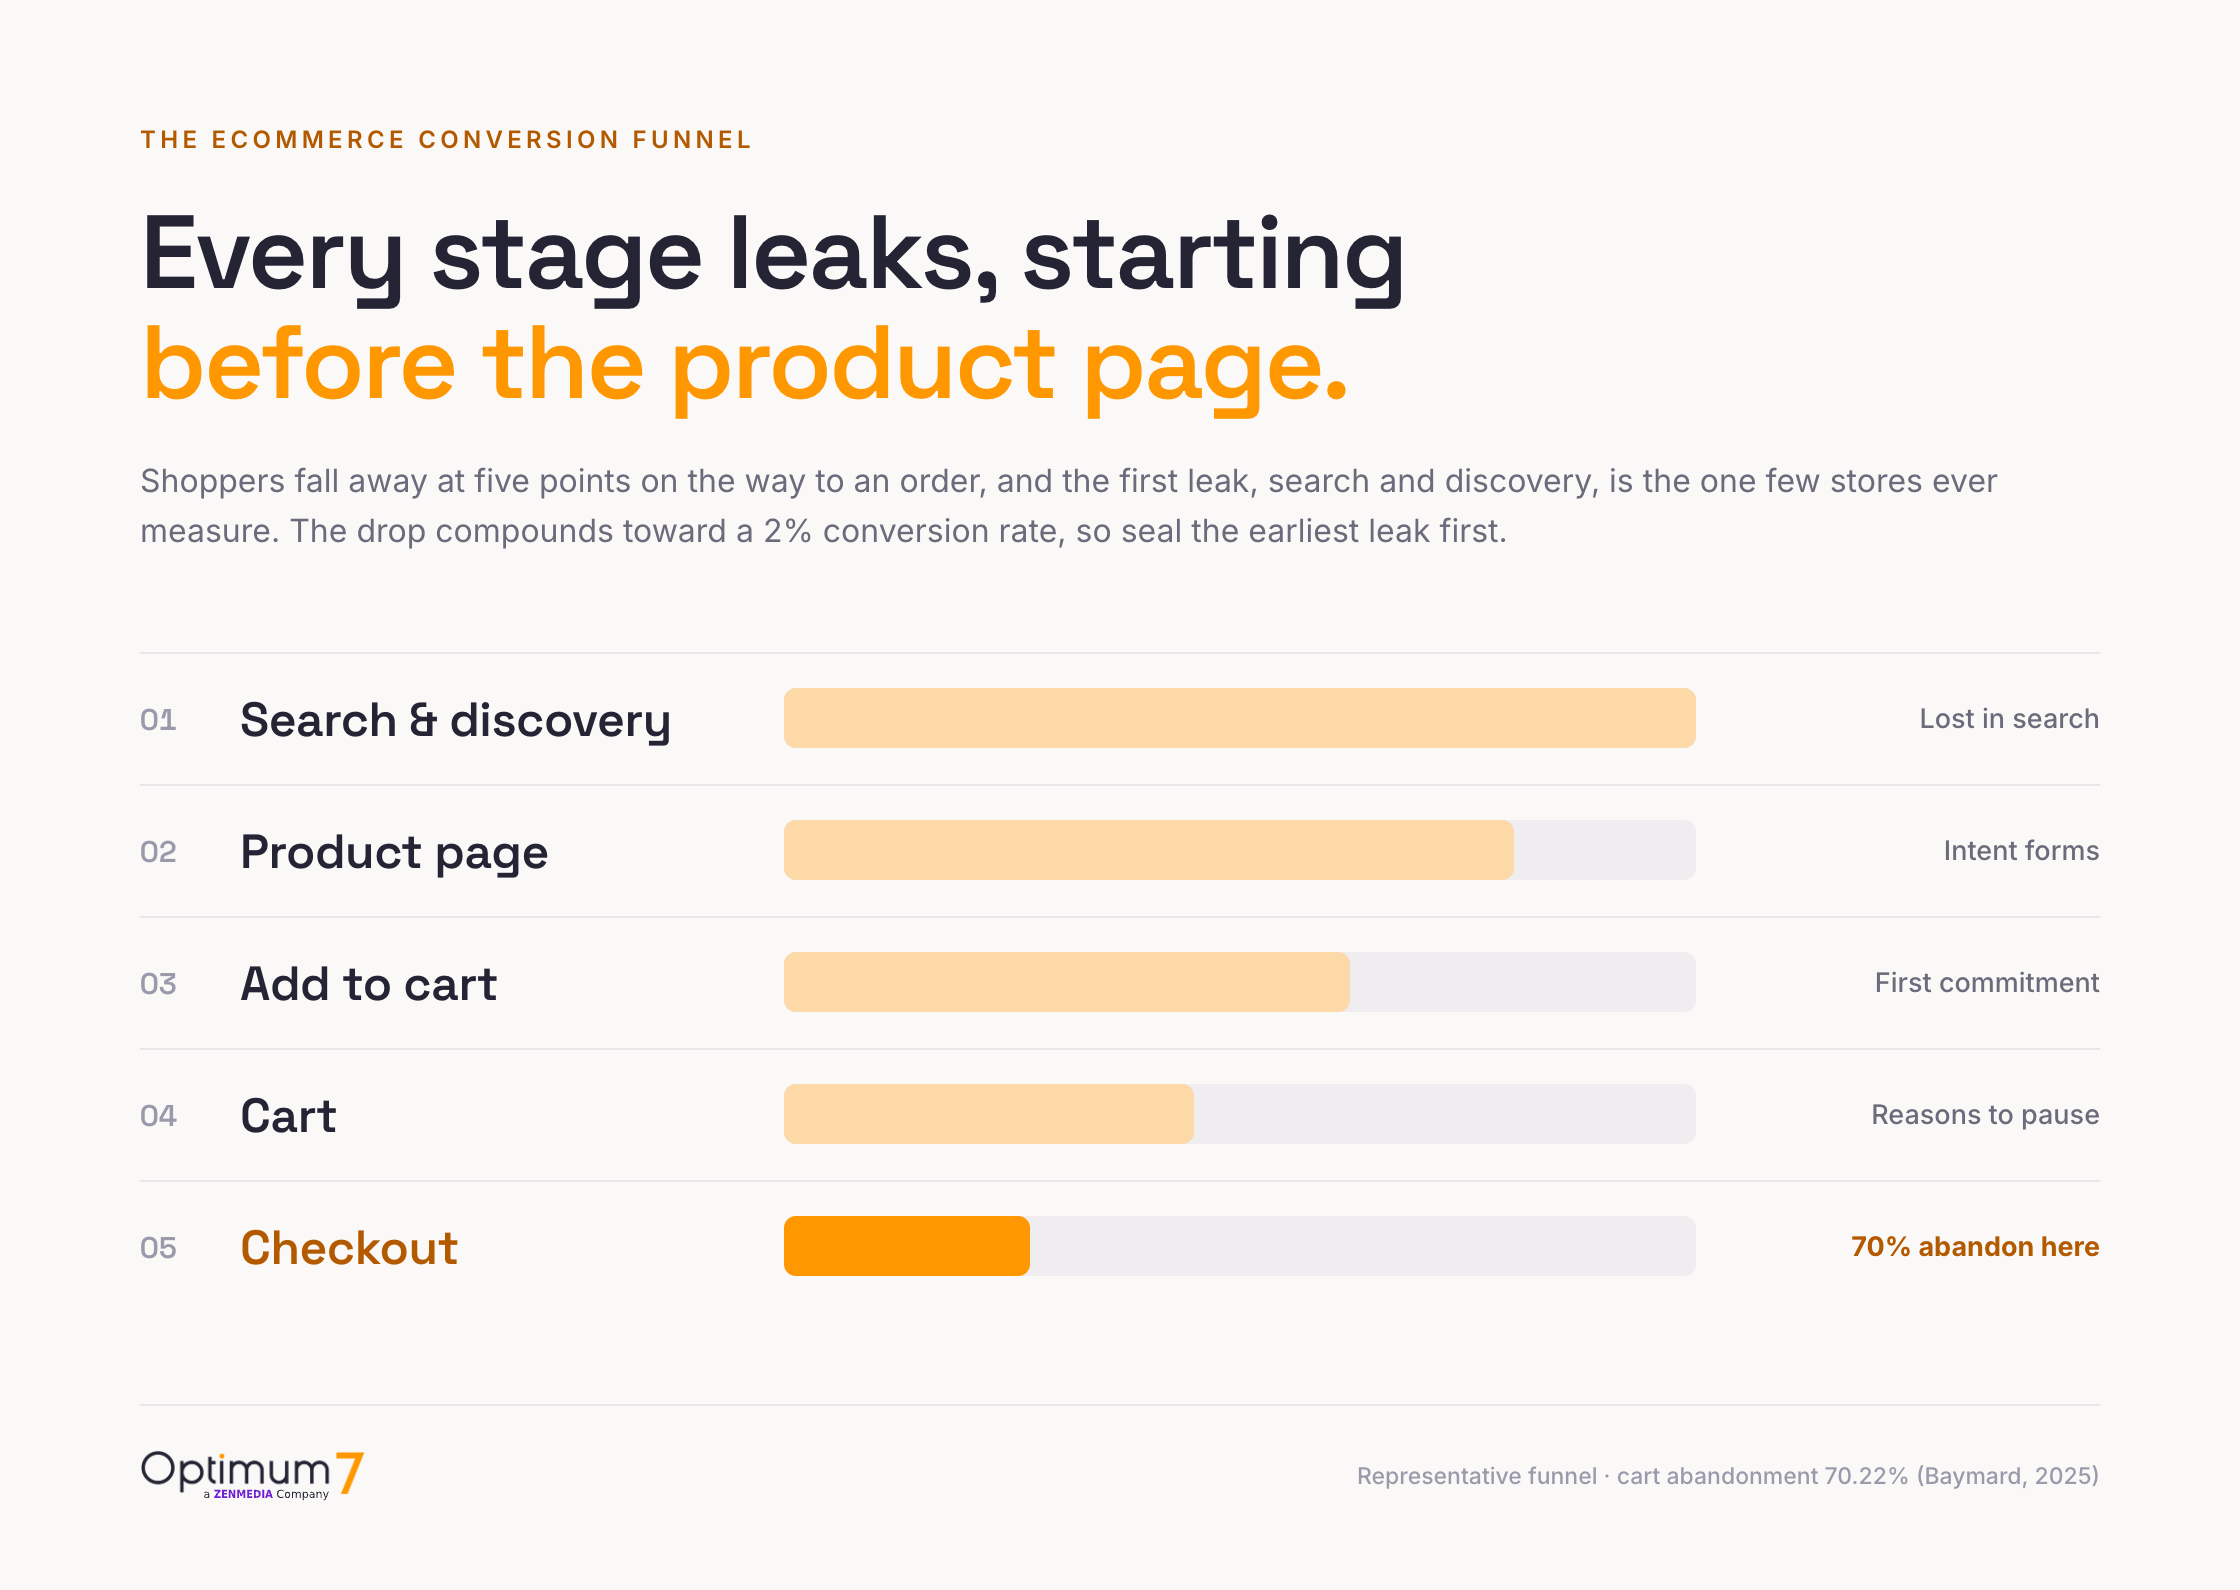
The single largest leak in ecommerce is the checkout. Across a synthesis of 50 studies, the documented average shopping cart abandonment rate is 70.22%, meaning roughly seven of every ten shoppers who add a product never complete the order. Better checkout design recovers a large share of those lost orders.
Before you fix anything, find your own biggest leak. The three highest-impact levers, in the order to work them, are the product page, the checkout, and the account requirement that sits between them.


Search and Product Discovery: Conversion Before the Product Page
For any store past a handful of SKUs, the first conversion lever is whether a shopper can find the product at all. Someone who cannot surface the right item never reaches the product page, cart, or checkout at all, and it is the leak few stores measure, because analytics records the exit while the failed search leaves no trace. Fix discovery first and every downstream fix inherits more traffic.
The weight of this stage shows up clearly in buyer behavior. Optimum7, a Zen Media company, ran 100 real buyer questions from industrial and B2B shoppers through ChatGPT, Perplexity, Gemini, and Grok and analyzed all 400 answers, published as a full industrial ecommerce AI visibility report. The capabilities the engines rewarded all sat in the discovery layer: parametric filtering led at 92%, real-time inventory at 85%, part-number search at 78%, cross-reference and interchange at 72%, and category taxonomy at 65%. Price barely figured in the ranking.
Optimum7 analysis of 100 industrial and B2B buyer questions across ChatGPT, Perplexity, Gemini, and Grok, 2026.
These are high-intent searches. The buyers arrive knowing the exact part and leave the moment search fails them, which is why the queries read like spec sheets.
“Which industrial site lets me filter pneumatic fittings by thread type, tube OD, and material in the same search?”
“I need a cross-reference replacement for a Parker 925-10-10 fitting, where can I enter the OEM part number and find an equivalent in stock?”
“I need a 6203-2RS bearing by exact SKU, which distributor lets me search and add to cart right away?”
The build follows the data. The highest-return discovery work is a short list: multi-attribute parametric filters that narrow a catalog by several specifications at once, part-number and SKU search that recognizes the full string, cross-reference lookups for legacy or competitor parts, a clean category taxonomy, and real-time inventory in place of a contact-us form. Underneath all of them sits the same mechanic, a filter sidebar and real-time results that narrow a wide catalog without a page reload, which turns a large catalog from a maze into a path to the buy button.
The pattern repeats across catalog-heavy stores. Improving how people search and filter is one of the highest-return changes you can make, and it compounds with organic traffic, because better on-site discovery keeps visitors from bouncing back to Google. For a deeper build, see the guide on AI-powered search and filter functionality.
Findability now drives AI visibility too
The discovery layer carries a second payoff that did not exist two years ago. When a buyer asks ChatGPT or Perplexity where to buy a specific part, the engine assembles its answer from the same structured product data that powers your on-site search, and distributor product pages were the top-cited source in the analysis, appearing in 92% of answers. A catalog a shopper can search cleanly is a catalog an AI can read and cite, so the filtering, part-number, and specification work compounds twice: more on-site conversions now, and more AI-driven discovery as buyers move their searches into AI tools. The same discipline anchors a full B2B store redesign around spec-based search, and the guide on SEO for AI-based search engines covers the citation side in depth.
Product Page Optimization for Ecommerce
The product detail page is where a browser decides to become a buyer. If a shopper has to email you to understand what they are getting, the page has already failed. A strong product page answers three questions above the fold: what is this, why is it right for me, and what happens after I buy.
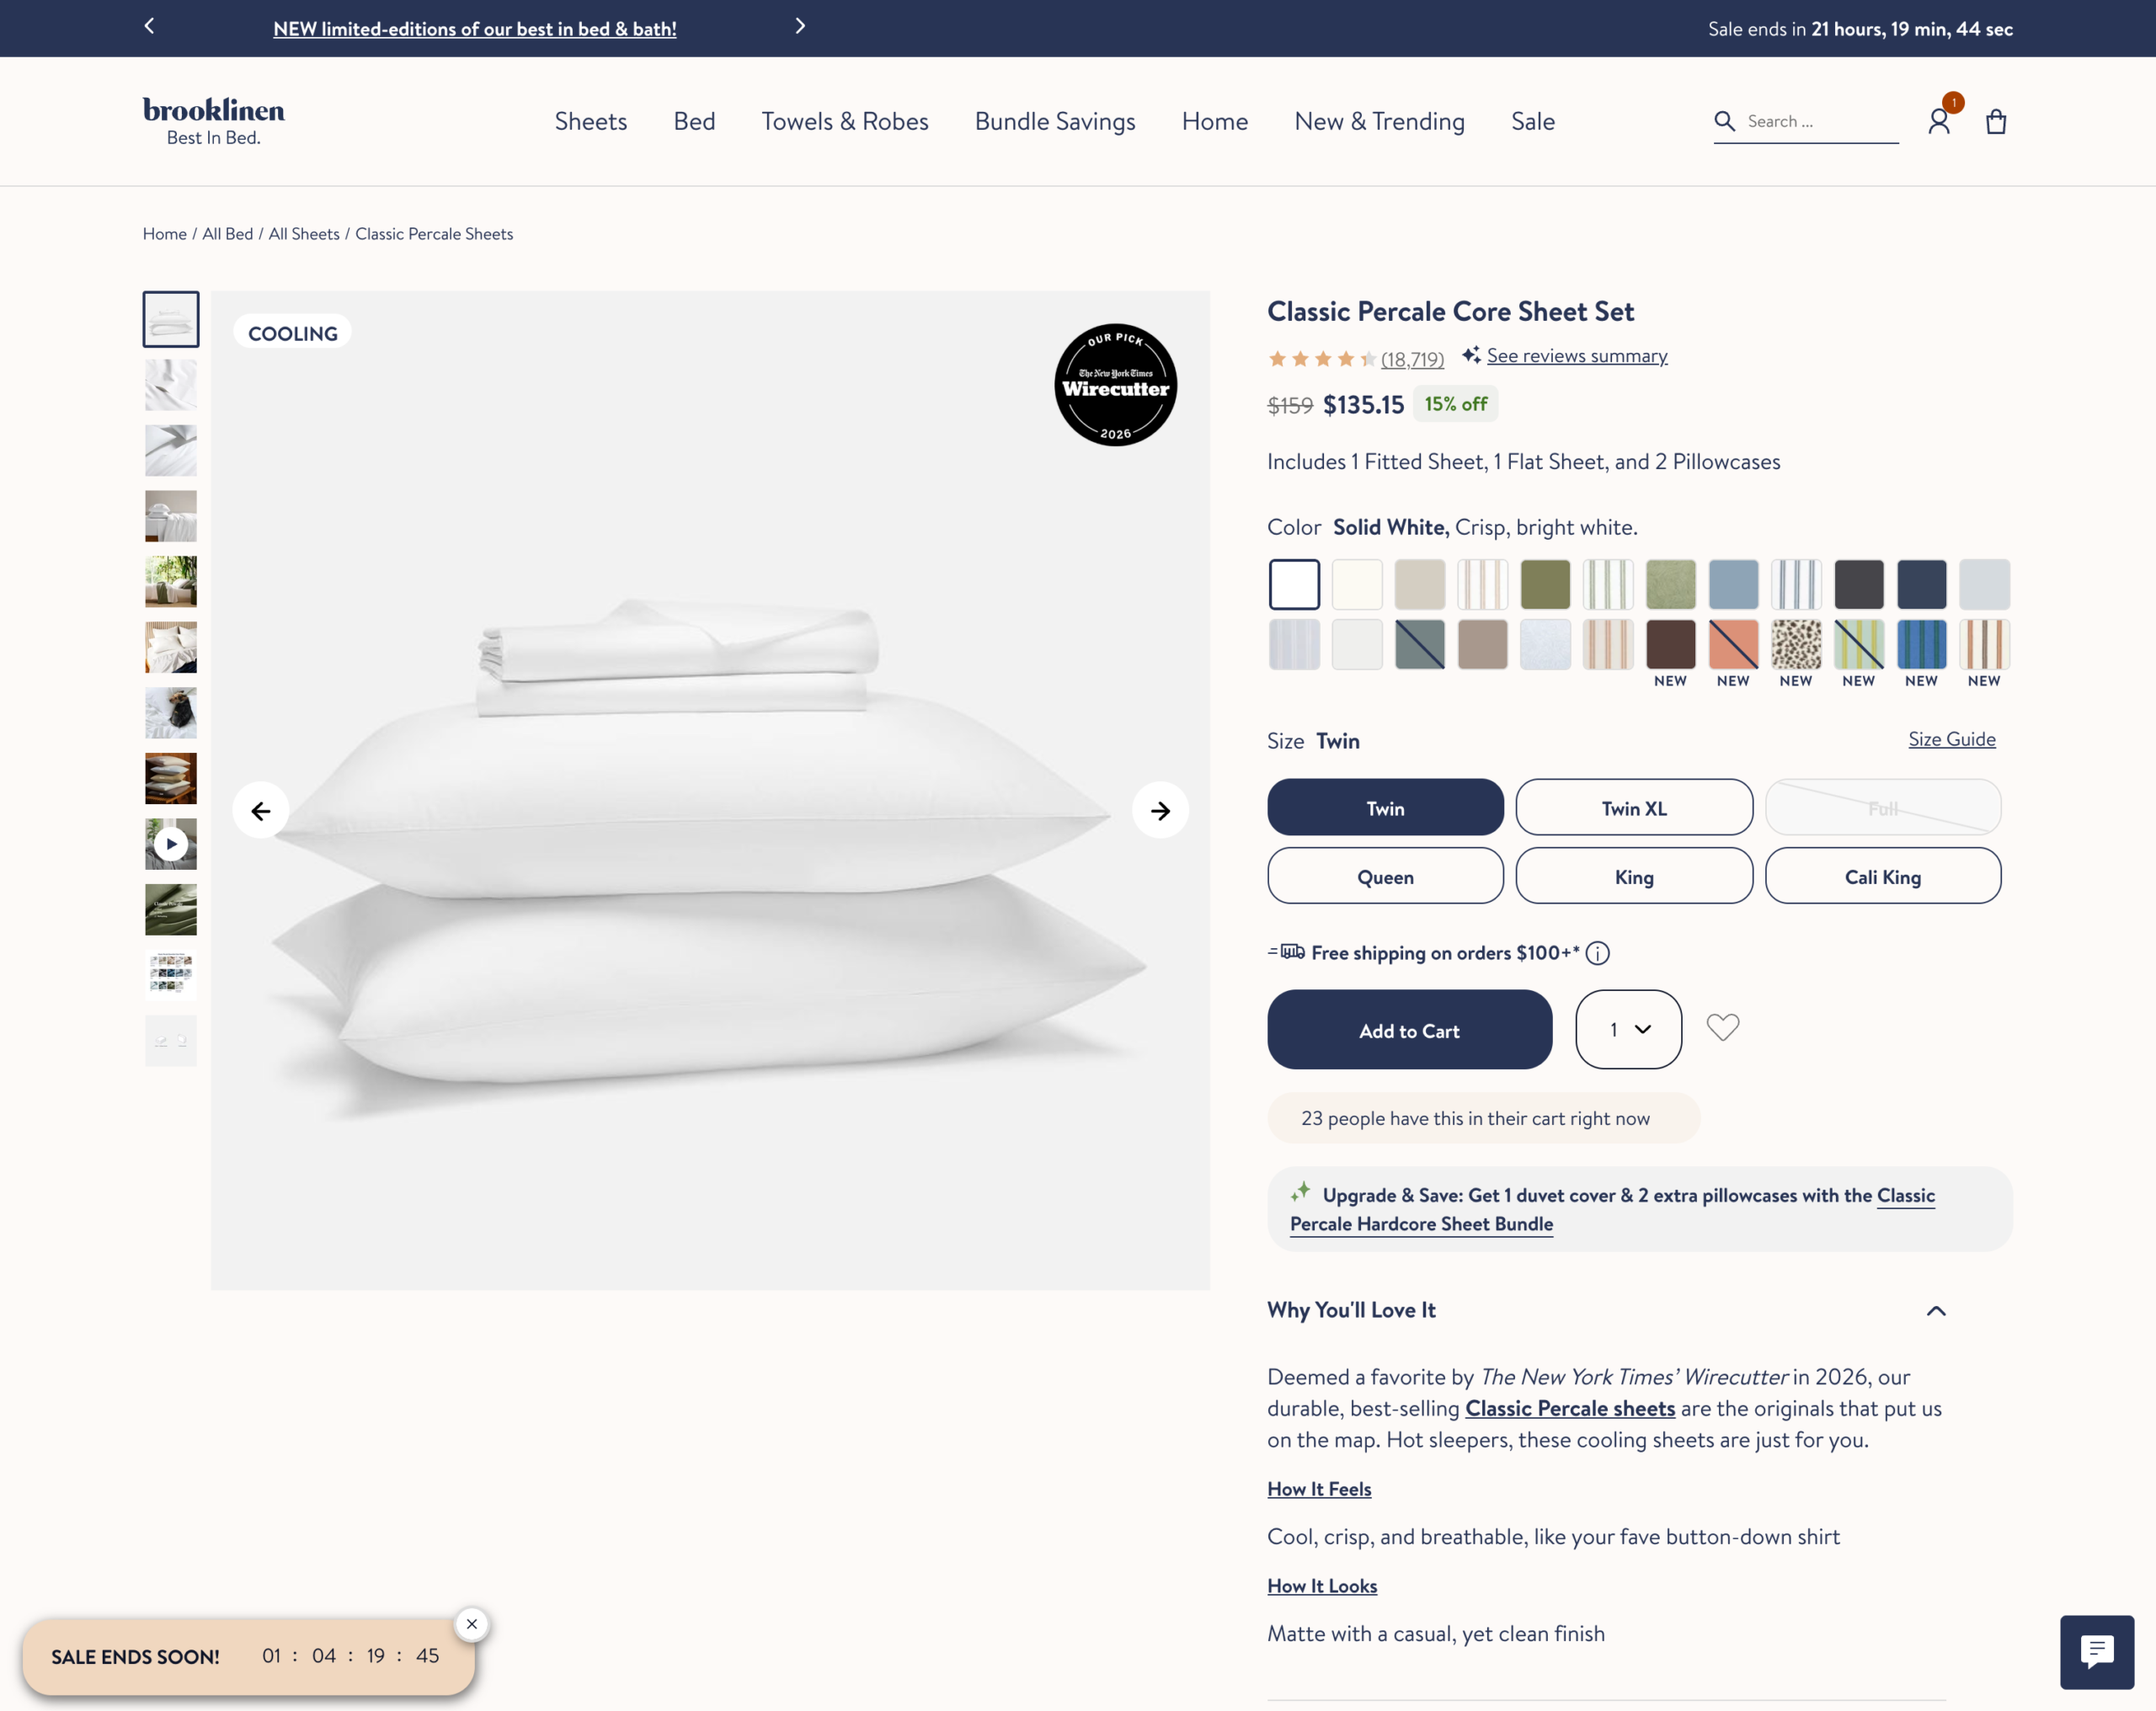
The first screen: imagery, price, and trust
Shoppers judge a product in seconds. Lead with high-resolution images that zoom, a short video for anything with texture or scale, and a price with shipping expectations stated plainly. Put the primary call to action and the delivery estimate high on the page, within the first screen. On mobile, that first screen is the entire storefront for phone shoppers.
Cart and Add-to-Cart UX
The moment a shopper adds an item is the first commitment, and it is easy to waste. A hard redirect to a full cart page interrupts browsing and drops the shopper out of shopping mode. A soft add-to-cart, a slide-out drawer that confirms the item and offers a clear path to keep shopping or check out, keeps momentum without forcing a decision too early.
The cart itself is a decision engine. Show the shipping threshold they are close to hitting, surface one relevant add-on, and make quantity edits effortless. Every element should reduce the number of reasons to pause. A cart upsell handled well raises average order value without adding friction, which is how you grow revenue even when the conversion rate holds steady.
A technical-parts buyer, and anyone making a considered purchase, arrives knowing what they need, so the cart’s job is to remove doubt fast, confirm compatibility, price, and delivery, and clear the path to pay.
Checkout Optimization and Field Reduction
Checkout is where the largest number of orders die and where the fastest wins live. The average ecommerce checkout asks for 11.3 form fields, and research finds the optimal count is 8. Cutting roughly three fields removes typing, doubt, and drop-off at the exact moment a shopper is closest to paying you.
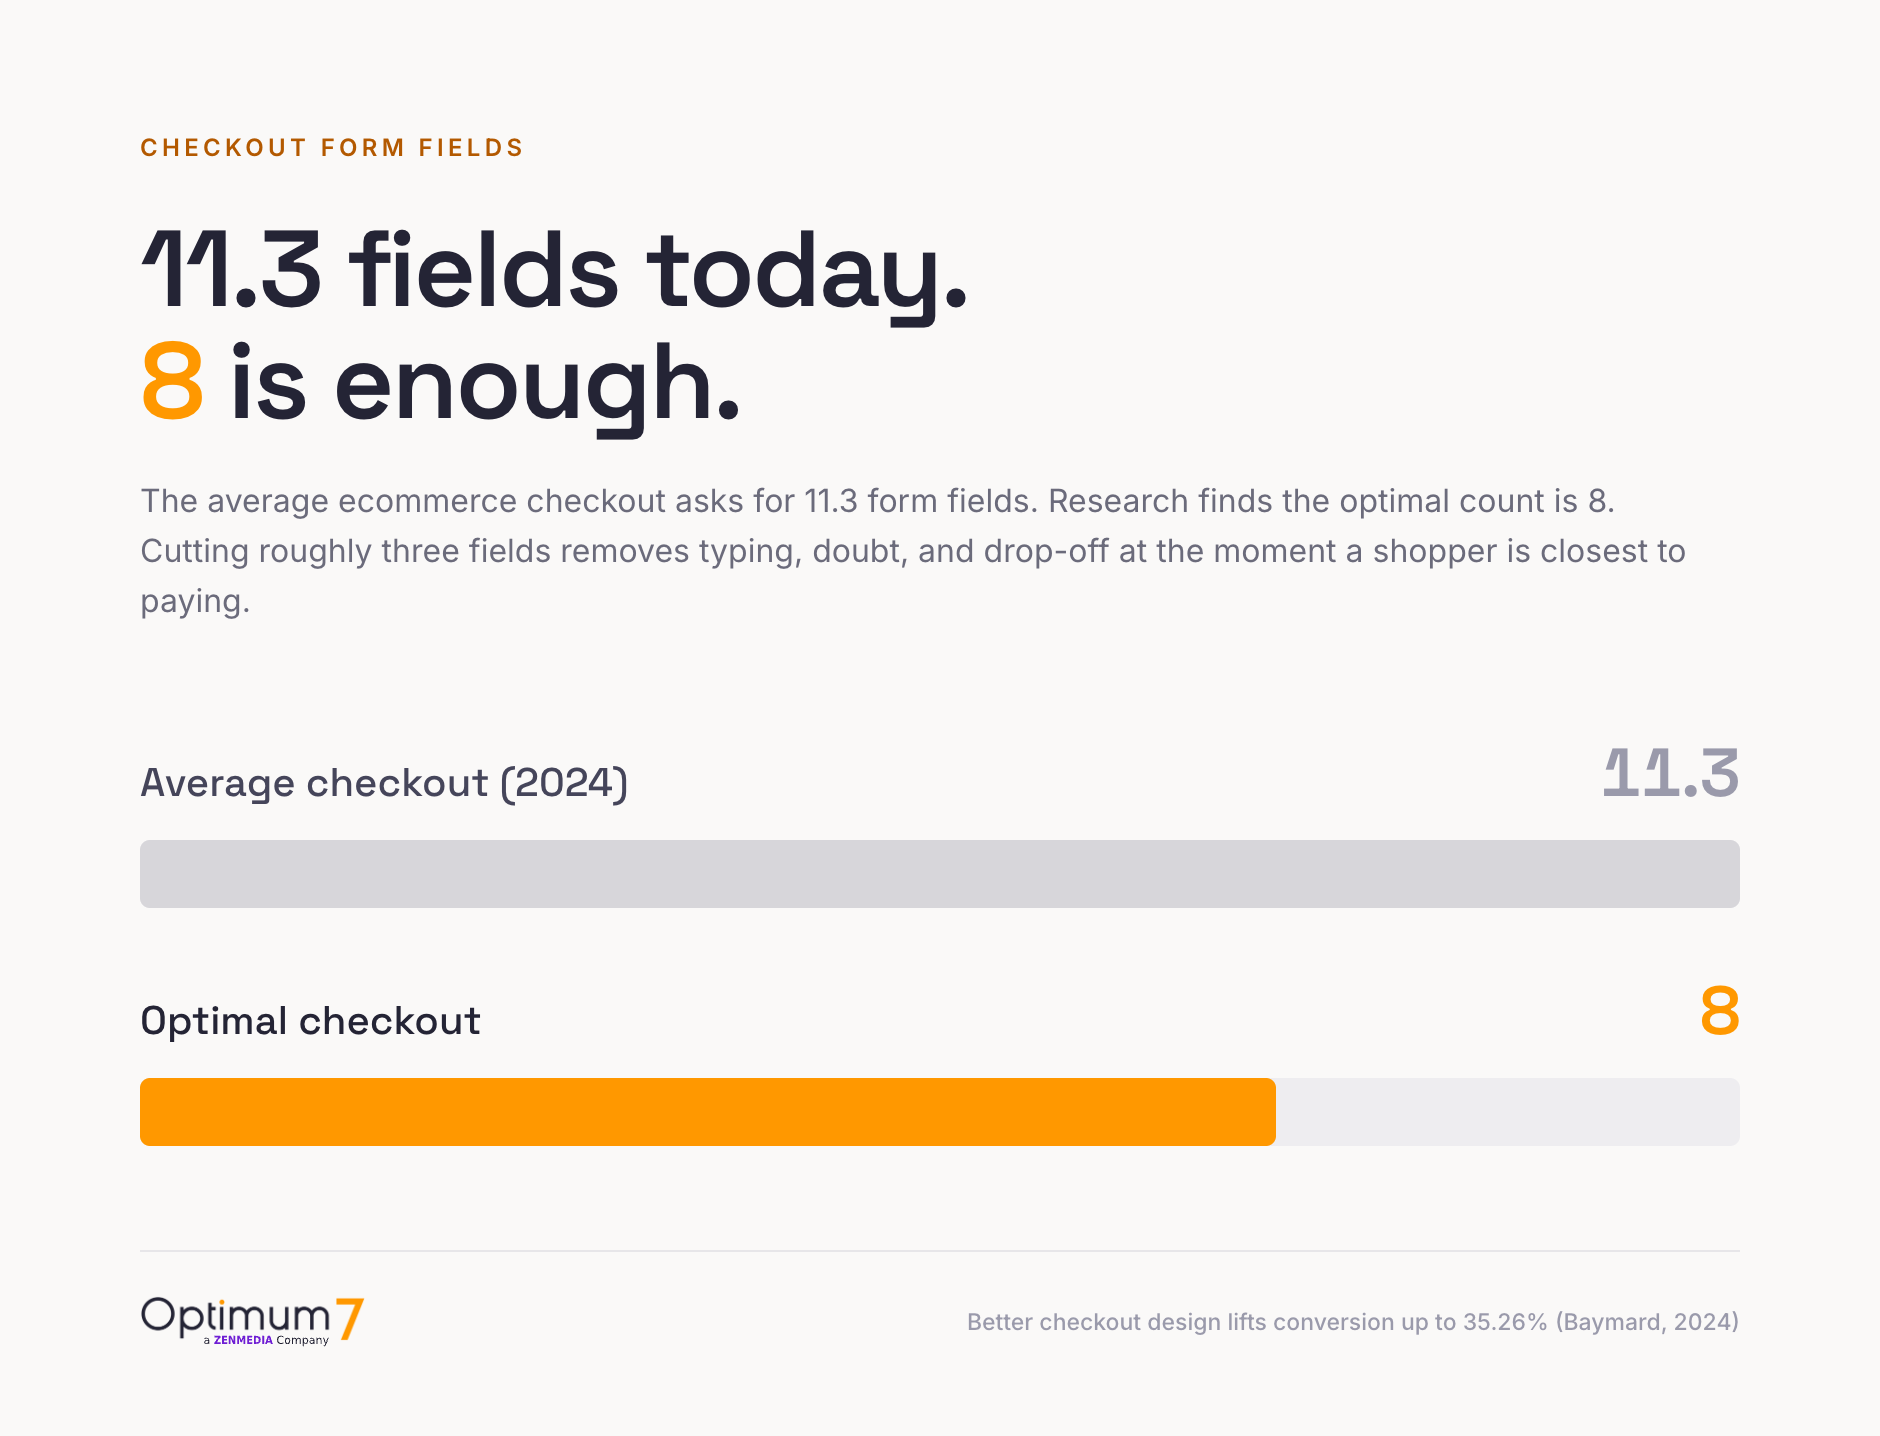
Beyond field count, four checkout changes carry the bulk of the gain: offer guest checkout so no one has to create an account to buy, show total cost including shipping and tax before the final step, keep payment on a single fast screen, and support express wallets like Apple Pay and Shop Pay that skip manual entry entirely. Each one attacks a documented reason shoppers quit.
Unexpected costs at the final step are the number-one reason shoppers abandon a cart. Hiding shipping, tax, or fees until checkout trains buyers to distrust your prices. Show the full total early, even when the number is higher than they hoped, and you keep the orders that a surprise would have lost.
If your checkout runs on custom scripts or complex discount logic, audit that logic before you touch the design, because a slow or conditional checkout step can undo every field you remove. The Shopify checkout logic audit guide walks through how to find those hidden delays.
How to Reduce Cart Abandonment
Reducing cart abandonment starts with knowing why it happens. When you set aside shoppers who were only browsing, the preventable causes cluster tightly, and every one of them is a design decision you control.
Recovery follows prevention. Once the checkout itself is clean, an abandoned-cart email or SMS sequence catches the shoppers who left for reasons outside your store. A custom checkout package that combines guest checkout, a cart upsell, and clearer shipping options can cut abandonment sharply while lifting conversion at the same time.
Mobile Conversion Rate Optimization
Mobile now converts at 2.88% against desktop’s 2.37%, and it carries the majority of ecommerce traffic. That makes your mobile experience the primary storefront in its own right. Design for the thumb: large tap targets, a sticky add-to-cart bar that stays in reach, and forms that trigger the right keyboard for each field.
Speed is trust on mobile. A checkout that stutters on a phone reads as unsafe, and shoppers back out before they can name why. Compress images, defer non-critical scripts, and test the real checkout on a mid-range phone over a normal cellular connection, the way a customer meets it. Express wallets earn their place here, because typing a card number on a phone is the highest-friction step in mobile checkout.
Behavioral Design and Persuasion Triggers
Shoppers decide on emotion as much as logic, and good CRO works with that. The goal is to remove doubt at the moment it forms, using signals that are true. Have you ever left a full cart because you were unsure the store was legitimate? Honest behavioral cues answer that hesitation before it costs you the sale.
Behavioral design pays off best when the same discipline runs through the whole journey. A B2B distributor that combined guided product discovery, a configurator, and a conditional checkout saw conversion and order value climb across the board, proof that persuasion and structure reinforce each other.
How to Diagnose Conversion Problems With Data
You cannot fix what you cannot see. Guessing at conversion problems wastes tests and erodes team trust in CRO. Four diagnostic tools turn a vague low number into a specific, fixable list, and three of them are free to start.
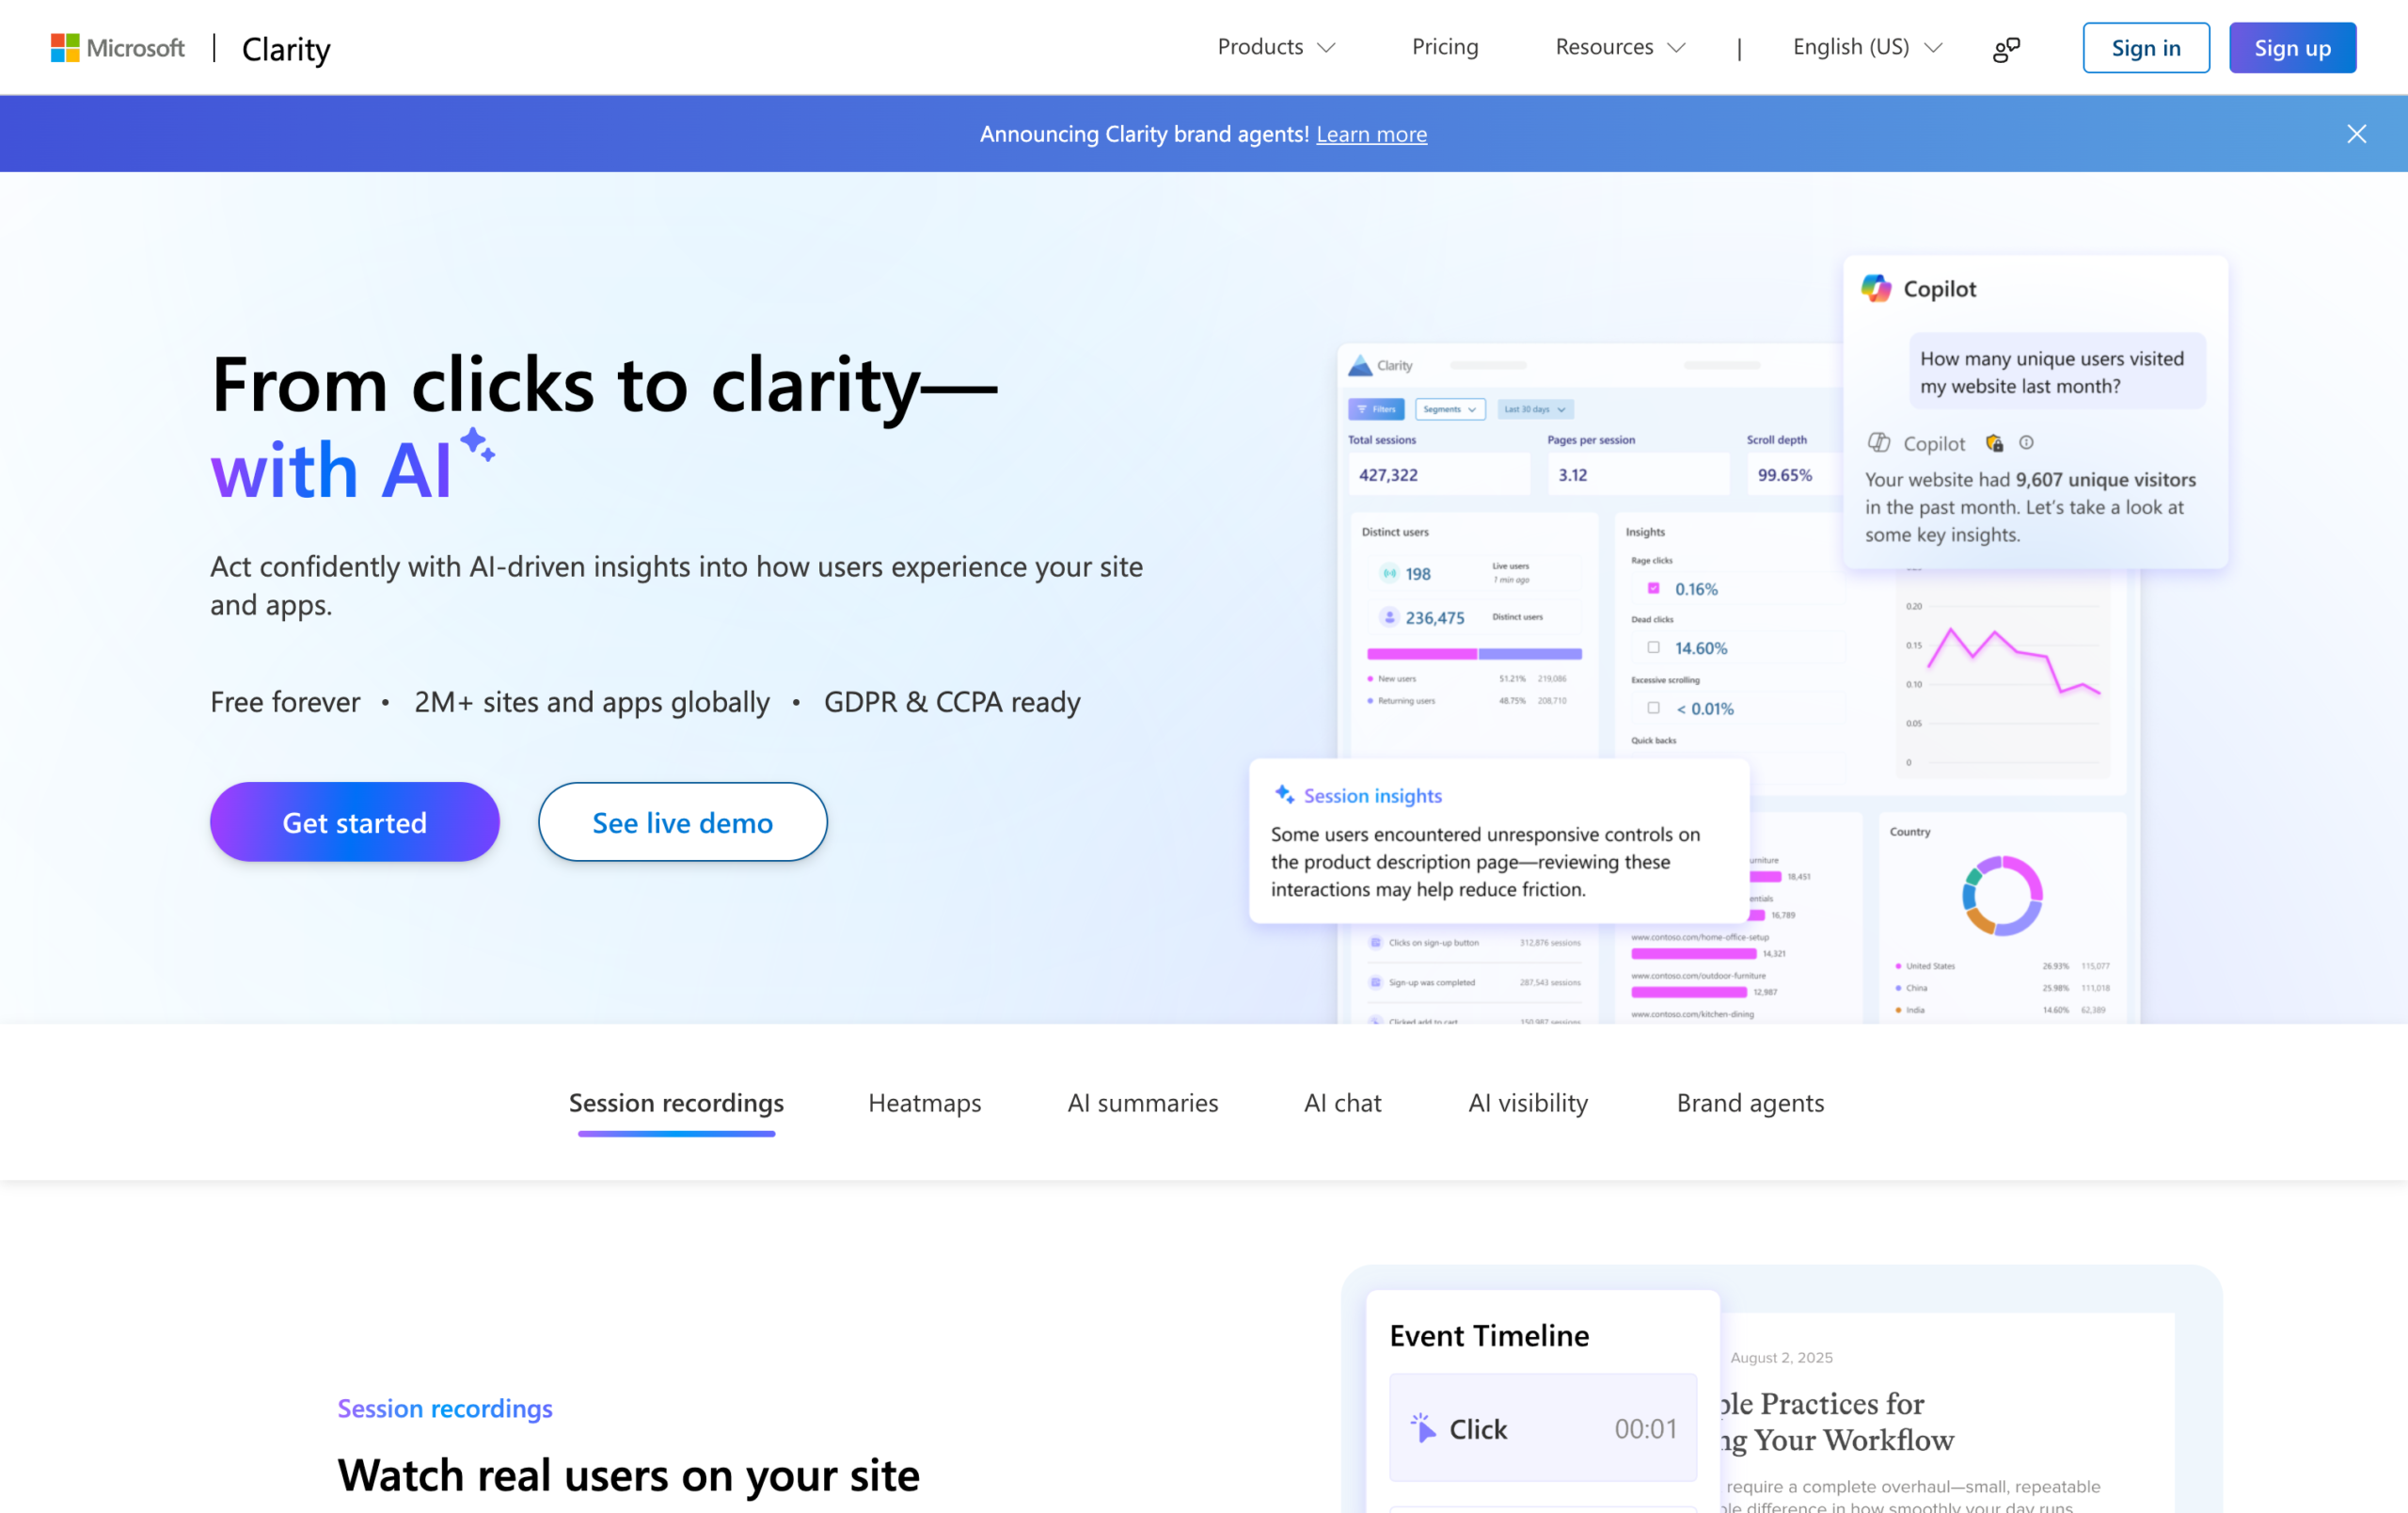
Heatmaps and session replays
Heatmaps show where attention pools and where it dies, revealing if shoppers ever see your call to action or scroll past it. Session replays let you watch real visits, so you see the exact field where a checkout rage-click happens. Free tools like Microsoft Clarity make both accessible to any store on day one.
Funnel analysis and A/B testing
Funnel analysis quantifies the leak: it tells you that 62% reach the cart but only 30% start checkout, so you know where to look before you form a hypothesis. A/B testing then confirms if your fix worked. The method is simple discipline: change one variable, run the test until it reaches a reliable sample, and keep the winner. Aim for a few hundred conversions per variant before you trust a result.
Navigation and Site Speed
Two structural factors move conversion before a shopper ever reaches a product: how fast pages load and how easily people find what they came for. A confusing menu buries products, and a slow page loses the shopper before it renders. Both are fixable, and both lift conversion across the entire catalog at once.
A single navigation change can move the number meaningfully. Reorganizing a large catalog under a clear mega menu helped one supplement retailer lift conversion by more than half, while cutting bounce and raising dwell time in the same period.
Page speed is a conversion lever with a direct line to revenue: a faster storefront holds shoppers who would otherwise leave during the load. For platform-specific tuning, see the guide on website speed optimization for Shopify and BigCommerce.
How to Run an Ongoing CRO Program
Compounding conversion gains come from a weekly rhythm with three fixed parts: someone who owns the number, a steady testing cadence, and a clear problem behind every test. A one-time redesign gives you a single bump; a program gives you a curve. Miss any one of the three parts and the program stalls after the first win.

The measure-hypothesize-test-keep loop is the whole discipline. Measure to find the leak, form a hypothesis about the cause, test one change, and keep the winner before starting the next cycle. Do that every week and the gains compound across the whole funnel.
Conversion lifts across Optimum7 client work
Across footwear, auto parts, supplements, furniture, and industrial B2B, on Shopify and BigCommerce, the through line is the same: find the leak and fix it. Here are the conversion-rate gains from those builds.
Optimum7 client results. Timeframes vary by engagement, and some remain undisclosed.
Optimum7 builds conversion improvements into product pages, carts, and checkout for growing Shopify and BigCommerce brands. Start with a look at where your funnel leaks.
Frequently Asked Questions
Why are my Shopify conversion rates stuck at 1.4% despite good traffic?
Good traffic with a low conversion rate points to friction inside the funnel. The usual culprits are a slow or field-heavy checkout, hidden shipping costs, weak product pages, or a mobile experience that lags. Start with a session replay and a funnel report to find the stage where shoppers drop, then fix that one leak before touching anything else.
What is a good conversion rate for an ecommerce store?
The global average is 2.72%, so a well-optimized store should aim for 3% or higher. Read the number by device and segment before judging it, because a healthy desktop rate can mask a weak mobile funnel. Compare against your own past performance and your category benchmark.
How do I calculate my ecommerce conversion rate?
Divide completed orders by total sessions and multiply by 100. A store with 300 orders from 15,000 sessions converts at 2%. Track it weekly, and segment by traffic source and device so you can see which channels and screens turn visits into sales.
How much can checkout optimization increase conversions?
Research from the Baymard Institute finds that better checkout design can raise a large store’s conversion rate by up to 35.26%. The biggest gains come from cutting form fields toward the optimal eight, offering guest checkout, showing full costs early, and adding express wallets that skip manual card entry.
How long does conversion rate optimization take to show results?
Quick fixes like guest checkout or clearer shipping costs can move the number within weeks. Structural gains from a testing program build over months, because each test needs enough conversions to trust the result. Treat CRO as an ongoing rhythm, and the compounding shows across a quarter.
What tools do I need to start CRO?
Three free tools cover the basics: an analytics platform for funnel data, a heatmap and session-replay tool such as Microsoft Clarity, and your store’s built-in A/B testing or a simple testing app. Start there, find your biggest leak, and add paid personalization tools only once the fundamentals are working.
Does better on-site search help my products show up in AI search?
Yes. AI engines build their answers from structured product data, and in an Optimum7 analysis of 400 AI responses, distributor product pages were the top-cited source at 92%. The same clean specifications, filters, and part-number data that help shoppers find products on your site help AI engines read and recommend them, so the two compound.
About the author: Duran Inci is the CEO and Co-Founder of Optimum7, an ecommerce development and digital marketing agency. He helps mid-market and enterprise brands scale revenue through conversion optimization, SEO, and custom ecommerce solutions.